Pillar 4 – Monitoring and Evaluation: Ecological Monitoring
← Back to Pillar 4 – Monitoring and Evaluation

Quick tips:
A well planned and resourced monitoring program has significant benefits for a demonstration reach project, including:
- Enabling an adaptive management approach to be taken. Proponents can learn from poor results (e.g. rehabilitation actions that have no beneficial impacts on fish communities or are selective to some species only) so that these suboptimal actions are not continued for the life of the project.
- Allowing the benefits of the rehabilitation program to be clearly demonstrated to the community, greatly assisting ongoing support and engagement.
- The investors in the project (both financial and resources) can see the benefits from their investment and that best practice is being followed.
- Demonstrating outcomes will assist in applications to potential funding partners.
- The project will contribute to the overall knowledge of river rehabilitation techniques.
Current knowledge of the responses of native fishes to a particular river restoration activity, or a combination of activities remains limited; consequently learning must be a big component of such activities. Despite this, many if not most, rehabilitation projects are undertaken without any substantial monitoring taking place. Where monitoring does occur, surrogates such as physical condition, increase in woody debris, water quality etc. may be used to infer improved conditions for biota.
Even within existing demonstration reaches, it has proved difficult to extrapolate results between reaches. Quite different results may be obtained depending on different geomorphology, climate, hydrology and fish faunas, and when interventions have been undertaken in slightly different ways according to local circumstances. Given our current state of knowledge of fish biology, it is not possible to make direct correlations between changes in physicochemical conditions and biological values for fish. Direct measurements of fish population parameters are required.
Developing and implementing a monitoring and evaluation plan:
- There is an existing framework developed by the MDBA to guide monitoring and evaluation plans in demonstration reaches (see Boys, et al 2009).
- Existing demonstration reaches have used jurisdictional natural resource management agencies (often fisheries departments) or consultants to develop and implement monitoring and evaluation plans.
- Rehabilitation goals are generally developed through the Whole of Life Plan and need to be agreed to by all stakeholders.
- All existing demonstration reaches have undertaken both condition (responses of fish to all interventions at the reach scale) and intervention (responses of fishes to specific interventions) monitoring.
- The development of conceptual models is key to understanding how the ecosystem may operate in relation to particular stressors and to developing hypotheses related to the impact of the interventions on the targeted fish populations; identifying appropriate indicators and sampling methods; and developing the experimental design.
- Given the importance of the experimental design and the statistical analysis of the data, it is essential that the services of a competent biometrician are sought.
- Implementation varies between reaches depending on the length of the reach and the particular interventions. Sampling sites normally include a number on a control reach and sampling methods depend on the location and characteristics of the reach.
- Regular analysis and reporting of results to all stakeholders is vital. It is important to release all findings whether they represent successes or failures.
- Given the long-term nature of fish population responses to interventions, it may be necessary to use surrogates (e.g. length of river re-snagged) and to “celebrate” achievements with the community in the short-term.
- Documenting the experimental design is important to ensure integrity of the program over a long period of time (10 years or more) and to ensure consistency of methodologies.
Further information is provided in the Planning Pillar.
In order to ensure a consistent approach to monitoring and evaluation across demonstration reaches, the MDBA commissioned the development of a “framework for developing and implementing ecological monitoring and evaluation of aquatic rehabilitation in demonstration reaches” (Boys et al. 2009). The reader is referred to this document for more details, but the key steps are summarised below, using experiences from existing demonstration reaches as a guide where possible.
The framework was compiled to ensure that a minimum standard of monitoring was undertaken at demonstration reaches but is flexible enough to allow the different challenges and circumstances at each demonstration reach to be taken into account.
In the development of a monitoring plan and its implementation it is important to have persons with the appropriate technical skills (e.g. qualified scientists). If these skills do not reside within the organisation leading the project it may be necessary to recruit personnel either through other agencies or via consultants.
Before planning a monitoring and evaluation program it is necessary to clearly define the rehabilitation goals for the demonstration reach. These should be articulated in the Whole of Life Plan and developed at the concept stage for the project. It is here that all stakeholders must agree on the type of restoration intervention improvements that will be sought. These improvements should be realistic, degraded rivers cannot be returned to pristine states and there will be social-economic constraints as well.
(See rehabilitation goals for existing demo reach whole of life plans in Example 5b.)
There are two types of monitoring that can be used in demonstration reaches, together they allow for a good understanding on both the combined impacts of monitoring interventions and the contributions of individual actions.
Condition monitoring
Trend or condition monitoring is used to report on broad scale patterns of river health through time. In demonstration reaches it focuses on the whole demonstration reach and how the condition of the fish community has changed over time. It will identify general trends in the reaches response to the interventions undertaken but gives no indication of the underlying mechanisms and contributions of the different interventions.
Intervention monitoring
Intervention monitoring focuses on the outcomes of particular on-ground actions, and their contribution to fish responses in the reach. The level of monitoring needed depends on the scale of the intervention being undertaken.
The development of monitoring and evaluation activities will be governed by the rehabilitation goals outlined in the Whole of Life Plan, and the interventions planned. To test these goals and interventions it is important to develop stressor/response conceptual models and hypotheses. These will bring together existing information on how the ecosystem may be expected to function and where the gaps in knowledge might be. Conceptual models can be quite simple diagrams. They are starting points gathering and developing knowledge about how the ecosystem in question may respond to the interventions and are qualitative in nature. However, they allow both the development of hypotheses to be tested and suitable indicators to be measured.
(See examples of conceptual models in Boys et al. 2009, Appendix 5, page 53 “Developing Conceptual Models”).
To suitably test conceptual models and hypotheses it is important to have a clear indication of what environmental indicators will be used to measure the condition and response (physical, chemical or biological). Indicators should be developed according to SMART criteria (Specific, Measurable, Achievable, Realistic and Time- bound). They should be measurable using existing and accepted methods (e.g. electrofishing, trapping etc.), and non-destructive to the ecosystem. Sampling of these indicators will allow for the statistical testing of the hypotheses.
(see Example 5d – Examples of indicators and sampling methods used by existing demonstration reaches).
The choice of experimental design is crucial to the success of the monitoring program. Regardless of the resources available, a poorly designed monitoring program will not provide useful information and can result in a waste of resources. The design has to be tailored to the specific project, but the Boys et al. (2009) document provides very good broad guidance. Decisions about statistical analysis methods should be made before data collection starts and both the sampling design and proposed analysis should be developed with the assistance of a competent biometrician.
The experimental design for demonstration reaches needs to incorporate monitoring over different space and time scales.
Spatial
Different spatial scales will be used to evaluate demonstration reach outcomes depending on the type of monitoring. Condition Monitoring will be carried out with the whole demonstration reach as the management unit. Within the demonstration reach, sites will have to be sub- sampled at the sub-reach scale to account for spatial variability. The number and location of these sub-samples will depend on the particular indicator, its patchiness and the statistical power required.
Intervention Monitoring will require a different spatial scale depending on whether the response is expected to occur at specific sites (e.g. placement of lunkers or large woody debris) or throughout the reach (e.g. cold water pollution or Carp management). It is important to remember, particularly in short demonstration reaches, that there can be confounding effects of multiple interventions on the impact of single interventions if interventions are undertaken too close to each other.
Temporal
Monitoring and evaluation programs associated with demonstration reaches need to be implemented over a number of years if an ecological response to interventions is to be detected. It may take 5 to 15 years to detect changes related to some on-ground activities particularly when considering natural “background” variability associated with extreme events such as floods and droughts. Depending on the indicator in question, there may be some short-term responses to interventions. For example, the placement of large woody debris in a reach may result in a relatively rapid increase in numbers of some species. This may simply be due to the woody debris acting as attraction devices, and actual increases in sustainable population numbers may take considerably longer to detect.
Likely response times will impact on the sampling regime and this needs to be made apparent to stakeholders so that there are no unrealistic expectations.
Overall Design
Although the overall monitoring designs for different demonstration reaches will vary, it is important that they include a period of before or pre-intervention monitoring as well as a period of after or post-intervention monitoring. The pre-intervention monitoring should cover a number of years if possible, to account for natural variability. Post-intervention monitoring may require sampling for a long period of time (e.g. 10 years) depending on the expected time lag for a fish population response to be detected. There should also be a control reach for comparison to ensure that the responses are due to the interventions and not natural variability. Together this will form a Before-After-Control-impact (BACI) design. (see Boys et al. 2009).
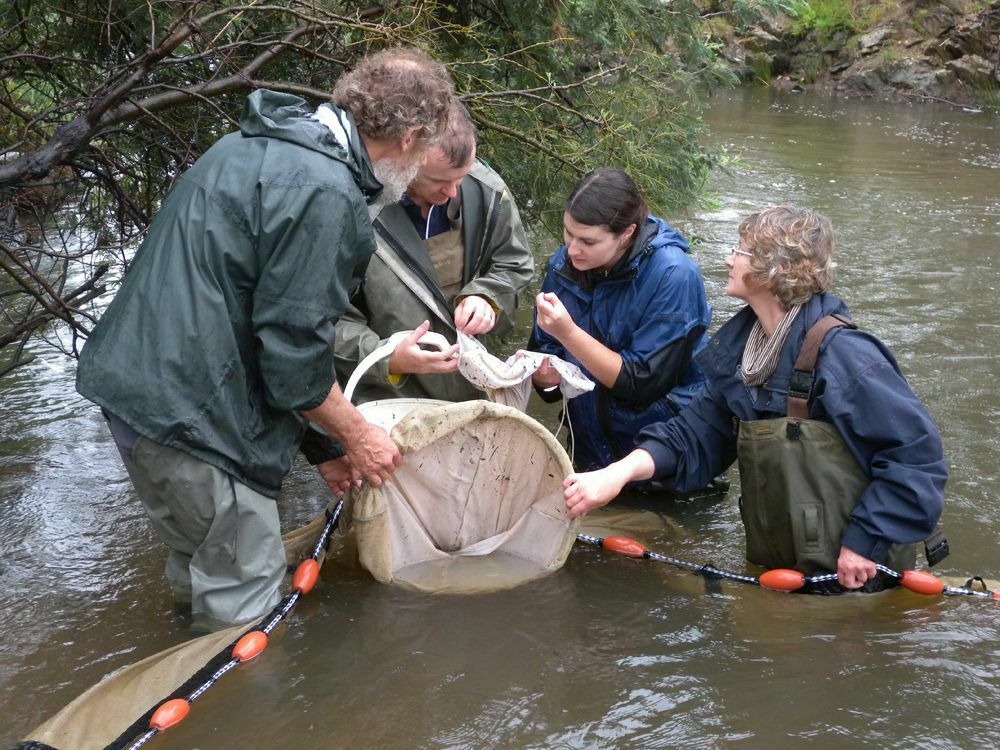
In most instances, monitoring programs have been undertaken by jurisdictional natural resource management agencies (usually Fisheries). These agencies have the necessary equipment (electrofishers, nets etc.), the permits and the expertise to use the equipment effectively.
The number of sampling sites varies from reach to reach. For example, the Ovens River Demonstration Reach (100km in length) has 10 sites within the reach (five treatment and five non-treatment sites) together with four control sites in the King River. Boat mounted electrofishers and baited traps are used to sample the fish community.
Hollands Creek Demonstration Reach (20km in length) has seven sampling sites within the reach and four control sites on Ryans Creek. Sampling is undertaken with backpack electrofishers (due to the shallow nature of the creek) and fyke nets. Sampling times vary from reach to reach but is usually undertaken annually in summer.
It is important that regular monitoring reports are produced (e.g. annually) and that these are made available to the steering committee and summaries of the results to the wider community. Both successes and failures should be reported so that an adaptive management approach can be taken. Given the expected time lag in native fish response to most management interventions it may be appropriate to celebrate interim milestones with the community such as length of river re-snagged etc.
Given the long time frame for the monitoring program (10 years or more) it is important to maintain its integrity through a quality assurance program and to ensure ongoing data analysis and data storage.


Allan, C. 2007. Adaptive management of natural resources. In: Wilson, A.I., Dehaan, R.I., Watts, R.I, Page, K.J., Bowmer, K.H. and Curtis, A. (eds.) Proceedings of the 5th Australian Stream Management Conference, Australian rivers: making a difference. Charles Sturt University, Thurgoona, New South Wales.
Boys, C.A., Robinson, W., Butcher, A., Zampatti, B. and Lyon, J. 2009. Framework for developing and implementing ecological monitoring and evaluation of aquatic rehabilitation in demonstration reaches. MDBA Publication No. 43/08. Murray-Darling Basin Authority, Canberra.
Boys,C., Alexander, T. Fowler, T. and Thieband, I. 2010. Interim monitoring report of the Namoi River Demonstration Reach 2011. M&E phase 1 report prepared for the Murray-darling basin Authority, NSW Department of primary Industries, Port Stephens Fisheries Institute, Nelson Bay, NSW.
Boys, C.A., Southwell, M., Thoms, M.C. et al. 2013. Evaluation of Aquatic Rehabilitation in the Bourke to Brewarrina Demonstration Reach, Barwon-darling River, Australia. Fisheries Final Report Series No. 134. NSW Department of Primary Industries, Port Stephens Fisheries Institute.
Boys, C.A., Lyon, J., Zampatti, B., Norris, A., Butcher, A., Robinson, W. and Jackson, P. 2014. Demonstration reaches: Looking back whilst moving forward with river rehabilitation under the Native Fish Strategy. Ecological Management and Restoration, 15 (suppl 1), 67-74.
Norris, A., Hutchison, M. and Chilcott, K. 2012. Dewfish Demonstration Reach Monitoring and Evaluation Report, Autumn 2012. Department of Employment, Economic Development and Innovation, Brisbane.
Norris, A., Hutchison, M. and Chilcott, K. 2014. Dewfish Demonstration Reach Monitoring and Evaluation Report Spring 2013. Department of Agriculture, Fisheries and Forestry, Brisbane.
Raymond, S., Hames, F., Lyon, J. and Tennant, W. 2013. Hollands Creek demonstration reach. Final Report 2012/13. Arthur Rylah Institute for Environmental research. Client Report. Department of Sustainability and Environment, Heidelberg.
Raymond, S., Lyon, J., Hames, F. and Wilson, A. 2013. Ovens River demonstration Reach. Final Report 2012/13. Arthur Rylah Institute for Environmental Research Client Report, Department of Sustainability and Environment, Heidelberg.
Palmer, M.A., Bernhardt, E.s., Allan, J.D., Lake, P.S., Alexander, G., Brooks, S., Carr, J., Clayton, S., Dahm, C.N., Follstad Shah, J., Galat, D.L., Loss, G., Goodwin, P., Hart, D.D., Hasset, B., Jenkinson, R., Kondoff, G.M., Lare, R., Meyer, J.L., O’Donnell, T.K., Pyano, L. and Sudduth, E. 2005. Standards for ecologically successful river restoration. Journal of Applied Ecology, 42, 208-217.
Wilson, P.J., Gehrig, S.L., Leigh, S.J., Bice, C.M. and Zampatti, B.P. 2013. Fish and aquatic habitats in the Katarapko Anabranch system (“Katfish”Demonstration Reach): “Before” intervention monitoring 2013. South Australian Research and Development Institute (Aquatic Sciencesa0, Adelaide, SARDI Publication No. F2012/000441-2, SARDI Research Report5 Series No.742.